Example Notebook Running SPARCSpy on datasets with multiple images
The SPARCSpy base Project class is focused on processing whole slide images. In case you want to process Image Datasets with multiple-images then you will need to use the SPARCSpy TimecourseProject class and associated methods. This tutorial will walk you through this process.
[1]:
import os
import numpy as np
import matplotlib.pyplot as plt
from tqdm.notebook import tqdm
import pandas as pd
import sys
import h5py

from sparcscore.pipeline.project import TimecourseProject
from sparcscore.pipeline.workflows import Multithreaded_Cytosol_Cellpose_TimecourseSegmentation
from sparcscore.pipeline.extraction import TimecourseHDF5CellExtraction
/fs/home/maedler/.local/miniconda3/envs/SPARCS_dev/lib/python3.10/site-packages/tqdm/auto.py:21: TqdmWarning: IProgress not found. Please update jupyter and ipywidgets. See https://ipywidgets.readthedocs.io/en/stable/user_install.html
  from .autonotebook import tqdm as notebook_tqdm
Some Helper Functions for visualization of results
[2]:
from sparcscore.processing.preprocessing import percentile_normalization
def plot_seg_overlay_timecourse(project_path, channel_to_show = 0, seg_mask_to_show = 0, selection = None, return_fig = False):

    seg_path = f"{project_path}/segmentation/input_segmentation.h5"
    with h5py.File(seg_path, "r") as hf:
        segmentation = hf.get("segmentation")
        channels = hf.get("input_images")

        print(segmentation)
        print(channels)

        if selection is None:
            segmentation = segmentation[0, seg_mask_to_show, :, :]
            image = channels[0, channel_to_show, :, :]

            fig = plt.figure()
            plt.imshow(percentile_normalization(image), cmap = "Greys_r")
            plt.imshow(segmentation, alpha = 0.5, cmap = "jet")
            plt.axis("off")

        if return_fig:
            return(fig)

def visualize_single_cells(project_path, n_cells = 10):
    cells_path = f"{project_path}/extraction/data/single_cells.h5"

    with h5py.File(cells_path, "r") as hf:
        cells = hf.get("single_cell_data")
        n_channels = cells.shape[1]

        fig, axs = plt.subplots(n_cells, n_channels, figsize = (n_channels*1, n_cells*1))

        for i in range(n_cells):
            image = cells[i]
            for n in range(n_channels):
                axs[i, n].imshow(image[n])
                axs[i, n].axis("off")
Initialize a Project
SPARCSpy works with a project structure that is kept the same across different projects. Each project contains all of the results from one run. Each Project has the same general structure:
.
├── classification
│   └── classifier_name
│       └── processing.log
├── config.yml
├── extraction
├── segmentation
└── processing.log
At the beginning of a SPARCSpy analysis a new project is generated where configuration parameters are loaded from the config file. This determines how each processing step will be executed.Here is a minimal example including the different cellpose segmentation methods for TimecourseProjects.
---
name: "HPA segmentation"
input_channels: 3
output_channels: 5 #always add 2 to the number of channels
Multithreaded_Cytosol_Cellpose_TimecourseSegmentation:
    input_channels: 3
    output_masks: 2
    threads: 2 #the segmentation model is loaded for each segmentation process utilizing GPU memory. Depending on GPU size this needs to be adjusted
    cache: "." #path to where intermediate results are written to memory mapped temp arrays
    lower_quantile_normalization:   0.000
    upper_quantile_normalization:   1.000
    median_filter_size:   4
    nucleus_segmentation:
        model: "nuclei"
        diameter: 400 #if this parameter is not set then cellpose will determine the diameter of the segemented shapes automatically
    cytosol_segmentation:
        model: "cyto2"
        diameter: 700
    chunk_size: 50
    filtering_threshold: 0.7
Multithreaded_Cytosol_Cellpose_Downsampling_TimecourseSegmentation:
    input_channels: 3
    output_masks: 2
    threads: 2
    cache: "."
    lower_quantile_normalization:   0.000
    upper_quantile_normalization:   1.000
    median_filter_size:   4
    nucleus_segmentation:
        model: "nuclei"
    cytosol_segmentation:
        model: "cyto2"
    chunk_size: 50
    filtering_threshold: 0.7
    downsampling_factor: 10 #downsamples images before performing segmentation, the segmented masks are upscaled again to the original dimension
    smoothing_kernel_size: 7
Cytosol_Cellpose_Downsampling_TimecourseSegmentation:
    input_channels: 3
    output_masks: 2
    threads: 8
    cache: "."
    lower_quantile_normalization:   0.000
    upper_quantile_normalization:   1.000
    median_filter_size:   4
    nucleus_segmentation:
        model: "nuclei"
    cytosol_segmentation:
        model: "cyto2"
    chunk_size: 50
    filtering_threshold: 0.7
    downsampling_factor: 10
    smoothing_kernel_size: 7
TimecourseHDF5CellExtraction:
    compression: True
    threads: 8 # threads used in multithreading
    image_size: 512 # image size in pixel
    cache: "."
    hdf5_rdcc_nbytes: 5242880000 # 5gb 2048 * 2048 * 1250
    hdf5_rdcc_w0: 1
    hdf5_rdcc_nslots: 1250
[3]:
#initialize project
project_location = f"/fs/pool/pool-mann-maedler-shared/sophia_workspace/Projects/timecourse_test_project"

project = TimecourseProject(project_location,
                             config_path= "config.yml",
                             segmentation_f=Multithreaded_Cytosol_Cellpose_TimecourseSegmentation,
                             extraction_f = TimecourseHDF5CellExtraction,
                             overwrite=False,
                             debug=False)
modifying config
/fs/gpfs41/lv07/fileset03/home/b_mann/maedler/Software/SPARCS_dev/SPARCSpy/src/sparcscore/pipeline/project.py:113: UserWarning: There is already a directory in the location path
  warnings.warn("There is already a directory in the location path")
Input Data Format
SPARCSpy was optimized to work with Data generated using an Opera Phenix Microscope. Each Project class has several data_loader functions associated with it that can be used to load data from different sources. You can find the code under src/sparcscore/project.py. The Dataloaders that load images from files are optimzied for file_name notation generated by the Phenix and the associated processing scripts.
Data Format for load_input_from_files:
.... main directory
    - Row02_Well02_Row02_Well02
        - Timepoint001_Row02_Well02_Alexa488_zstack001Row02_Well02.tif
        - Timepoint001_Row02_Well02_mCherry_zstack001_r000_c000.tif
        - Timepoint001_Row02_Well02_DAPI_zstack001_r000_c000.tif
    - ...
Alternatively you can load data from a numpy array using load_input_from_array which can be used more flexibly to write your own dataloader:
images needs to be supplied in the shape (N, C, X, Y) to the parameter img
labels need to be supplied as a tidy dataframe to the parameter label. The first two columns of the dataframe need to contian the following information: row_index, unique Image ID. Then you can append as many additional labels as you want.
Also feel free to submit a PR with a new dataloader for a common microscopy file format.
Example Load data using the from files function
[6]:
#%%timeit -n 1
channels = ["DAPI", "Alexa488", "mCherry"]
timepoints = ["Timepoint"+str(x).zfill(3) for x in list(range(1, 3))]
input_dir = "/fs/pool/pool-mann-maedler-shared/Test_Datasets/timecourse_small/timecourse_sorted"
plate_layout = "/fs/pool/pool-mann-maedler-shared/Test_Datasets/timecourse_small/plate_layout.tsv"

project.load_input_from_files(input_dir = input_dir,  channels = channels,  timepoints = timepoints, plate_layout = plate_layout, overwrite = True)
100%|██████████| 2/2 [00:00<00:00, 2.61it/s]
Images and labels are written to the input_segmentation.h5 HDF5 file contained under segmentation in the project folder. The input images are written to the container “input_images” and the labels to “labels”. Column names are saved in a seperate dataset with the name “label_names”.
[7]:
with h5py.File(f"{project_location}/segmentation/input_segmentation.h5") as hf:
    print(hf.get("input_images"))
    print(hf.get("labels"))

    print("Example Label Dataset")
    print(hf.get("label_names")[:])
    print(hf.get("labels")[:])
<HDF5 dataset "input_images": shape (4, 3, 1080, 1080), type "<u2">
<HDF5 dataset "labels": shape (4, 8), type "|O">
Example Label Dataset
[b'index' b'ID' b'location' b'timepoint' b'well' b'region' b'Genotype'
 b'Treatment']
[[b'0' b'Row02_Well04_r004_c004_Timepoint001' b'Row02_Well04_r004_c004'
  b'Timepoint001' b'Row02_Well04' b'r004_c004' b'WT_1' b'Unstimulated']
 [b'1' b'Row02_Well04_r004_c004_Timepoint002' b'Row02_Well04_r004_c004'
  b'Timepoint002' b'Row02_Well04' b'r004_c004' b'WT_1' b'Unstimulated']
 [b'2' b'Row02_Well02_r000_c000_Timepoint001' b'Row02_Well02_r000_c000'
  b'Timepoint001' b'Row02_Well02' b'r000_c000' b'WT_1' b'Unstimulated']
 [b'3' b'Row02_Well02_r000_c000_Timepoint002' b'Row02_Well02_r000_c000'
  b'Timepoint002' b'Row02_Well02' b'r000_c000' b'WT_1' b'Unstimulated']]
Example loading data via a numpy array
the timecourse SPARCSpy project expects images of the following format: NCYX.
All of the images need to have the same dimensions and the same number of channels. The channels should be in the following order: nucleus, cytosol, other channels.
The images need to have the dtype uint16.
Here we have example code which reads RGB images (saved as PNGs), converts them to the expected format and loads them into a SPARCSpy timecourse project.
[8]:
#read metadata of images
metadata = pd.read_csv("metadata.csv", index_col = 0)
metadata.head()
[8]:
| gene_id | antibody | species | cell_line | organ | cellosaurusID | location | image_URL | image_location | |
|---|---|---|---|---|---|---|---|---|---|
| 0 | ENSG00000000003 | HPA004109 | human | U2OS | Mesenchymal | CVCL_0042 | cytosol | http://images.proteinatlas.org/4109/23_H11_1_b... | images/00005.jpg |
| 1 | ENSG00000000003 | HPA004109 | human | U2OS | Mesenchymal | CVCL_0042 | cytosol | http://images.proteinatlas.org/4109/23_H11_2_b... | images/00006.jpg |
| 2 | ENSG00000000460 | HPA024451 | human | U2OS | Mesenchymal | CVCL_0042 | NaN | http://images.proteinatlas.org/24451/226_G2_1_... | images/00017.jpg |
| 3 | ENSG00000000460 | HPA024451 | human | U2OS | Mesenchymal | CVCL_0042 | NaN | http://images.proteinatlas.org/24451/226_G2_2_... | images/00018.jpg |
| 4 | ENSG00000000938 | HPA002024 | human | U2OS | Mesenchymal | CVCL_0042 | plasma membrane | http://images.proteinatlas.org/2024/59_H5_1_bl... | images/00023.jpg |
[9]:
#read images

from multiprocessing import Pool
from skimage.transform import resize

def read_image(img):
    I = plt.imread(img)
    # convert from rgb to brg (nucleus, cytosol, other)
    I = np.roll(I, 1, 2)
    if I.shape[0] != 2048:
        I = resize(I, (2048, 2048)) #some of the images have different shapes so we force resize of those images that dont match the most common shape

    # convert from H x W x C to C x H x W
    I = np.moveaxis(I, [2, 0, 1], [0,  1, 2])
    I = I.astype("float64")
    I = (I/I.max()*65535).astype("uint16")  #normalize all images to the same range and then convert to uint16
    return I

image_paths = metadata["image_location"]

pool = Pool(12) #allow reading images over multiple threads
images = pool.map(read_image, image_paths)
images = np.stack(images)
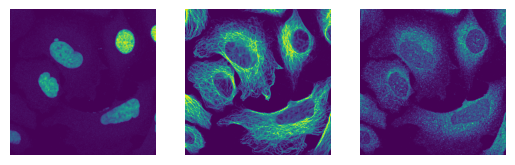
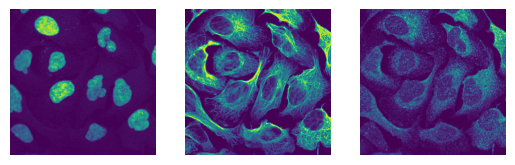
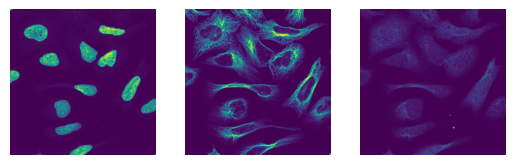
The images have the expected shape (10 images, 3 channels, 2048px, 2048px) and look as expected
[10]:
print(images.shape)
print(images.dtype)

for i in images[0:3]:
    fig, axs = plt.subplots(1, 3)
    axs[0].imshow(i[0])
    axs[0].axis("off")
    axs[1].imshow(i[1])
    axs[1].axis("off")
    axs[2].imshow(i[2])
    axs[2].axis("off")
(10, 3, 2048, 2048)
uint16
[11]:
#format the metadata to the expected format
metadata = metadata.reset_index()
metadata = metadata.get(["index", "image_URL", 'gene_id', 'antibody', 'species', 'cell_line', 'organ', 'cellosaurusID']) #here we use the image_URL as a unqiue image id
[12]:
#load data into sparcspy
project.load_input_from_array(images,
                             label = metadata,
                             overwrite = True)
<KeysViewHDF5 ['input_images', 'label_names', 'labels']>
Segmentation
SPARCSpy has different segmentation workflows between which you can choose. If you run a timecourse project you will need to also select a timecourse segementation method.
notes on cellpose segmentation methods:
Cellpose currently does not allow for the processing of image batches. Each image will thus be segmented individually on the GPU. In case you have large images this isnt an issue since the GPU is still fully utilzed (the sharding parameter can be used to set an optimal shard size for maximizing GPU utilization). For a large quantity of small images this leads to a very inefficient processing. To improve the speed a bit you can try running with multiple threads. Each thread will also load the model though so it requires quite some Memory overhead. This is hopefully an issue we can address in future releases. If its something you would like to work on get in touch with the developers we are happy for help!
[13]:
project.segment()
WARNING:root:Temp mmap arrays are written to /tmp/temp_mmap_t7889uf5. Cleanup of this folder is OS dependant, and might need to be triggered manually!
WARNING:root:Folder /tmp/temp_mmap_t7889uf5 with temp mmap arrays is being deleted.All existing temp mmapp arrays will be unusable!
WARNING:root:New temp folder location. Temp mmap arrays are written to /tmp/./temp_mmappc5_15oq. Cleanup of this folder is OS dependant, and might need to be triggered manually!
Generating Shards: 100%|██████████| 10/10 [00:00<00:00, 13025.79it/s]
  0%|          | 0/10 [00:00<?, ?it/s]WARNING:root:Folder /tmp/./temp_mmappc5_15oq with temp mmap arrays is being deleted.All existing temp mmapp arrays will be unusable!
WARNING:root:New temp folder location. Temp mmap arrays are written to /tmp/./temp_mmapry9pprzj. Cleanup of this folder is OS dependant, and might need to be triggered manually!
WARNING:root:Folder /tmp/./temp_mmappc5_15oq with temp mmap arrays is being deleted.All existing temp mmapp arrays will be unusable!
WARNING:root:New temp folder location. Temp mmap arrays are written to /tmp/./temp_mmapmnfdajf6. Cleanup of this folder is OS dependant, and might need to be triggered manually!
WARNING:root:Folder /tmp/./temp_mmappc5_15oq with temp mmap arrays is being deleted.All existing temp mmapp arrays will be unusable!
WARNING:root:Folder /tmp/./temp_mmappc5_15oq with temp mmap arrays is being deleted.All existing temp mmapp arrays will be unusable!
WARNING:root:New temp folder location. Temp mmap arrays are written to /tmp/./temp_mmapbc_n4alu. Cleanup of this folder is OS dependant, and might need to be triggered manually!
WARNING:root:New temp folder location. Temp mmap arrays are written to /tmp/./temp_mmap34detioy. Cleanup of this folder is OS dependant, and might need to be triggered manually!
WARNING:root:Folder /tmp/./temp_mmap34detioy with temp mmap arrays is being deleted.All existing temp mmapp arrays will be unusable!
WARNING:root:New temp folder location. Temp mmap arrays are written to /tmp/./temp_mmapd4b8tluv. Cleanup of this folder is OS dependant, and might need to be triggered manually!
WARNING:root:Folder /tmp/./temp_mmapmnfdajf6 with temp mmap arrays is being deleted.All existing temp mmapp arrays will be unusable!
WARNING:root:New temp folder location. Temp mmap arrays are written to /tmp/./temp_mmapp3hs2u_r. Cleanup of this folder is OS dependant, and might need to be triggered manually!
WARNING:root:Folder /tmp/./temp_mmapry9pprzj with temp mmap arrays is being deleted.All existing temp mmapp arrays will be unusable!
WARNING:root:New temp folder location. Temp mmap arrays are written to /tmp/./temp_mmapclg9qjls. Cleanup of this folder is OS dependant, and might need to be triggered manually!
 10%|█         | 1/10 [01:22<12:22, 82.49s/it]WARNING:root:Folder /tmp/./temp_mmapbc_n4alu with temp mmap arrays is being deleted.All existing temp mmapp arrays will be unusable!
WARNING:root:New temp folder location. Temp mmap arrays are written to /tmp/./temp_mmapso3tyehs. Cleanup of this folder is OS dependant, and might need to be triggered manually!
 50%|█████     | 5/10 [01:35<01:15, 15.15s/it]WARNING:root:Folder /tmp/./temp_mmapd4b8tluv with temp mmap arrays is being deleted.All existing temp mmapp arrays will be unusable!
WARNING:root:New temp folder location. Temp mmap arrays are written to /tmp/./temp_mmapa3dk_m7q. Cleanup of this folder is OS dependant, and might need to be triggered manually!
 60%|██████    | 6/10 [01:43<00:53, 13.43s/it]WARNING:root:Folder /tmp/./temp_mmapp3hs2u_r with temp mmap arrays is being deleted.All existing temp mmapp arrays will be unusable!
WARNING:root:New temp folder location. Temp mmap arrays are written to /tmp/./temp_mmapyaav5jws. Cleanup of this folder is OS dependant, and might need to be triggered manually!
100%|██████████| 10/10 [02:32<00:00, 15.24s/it]
All segmentations are done.
Adjusting Indexes: 100%|██████████| 10/10 [00:11<00:00, 1.14s/it]
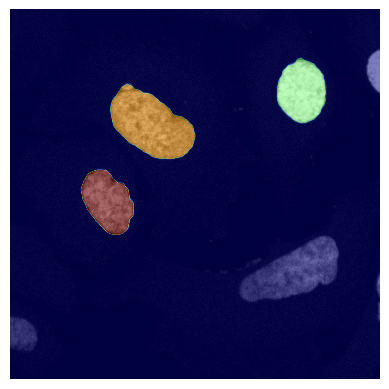
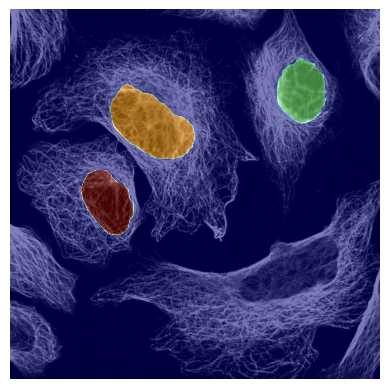
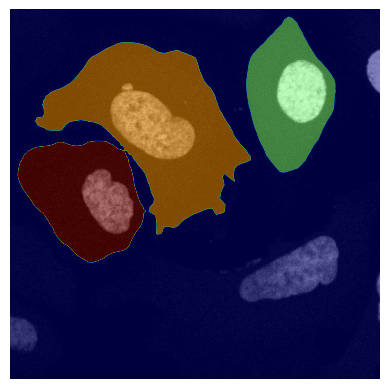
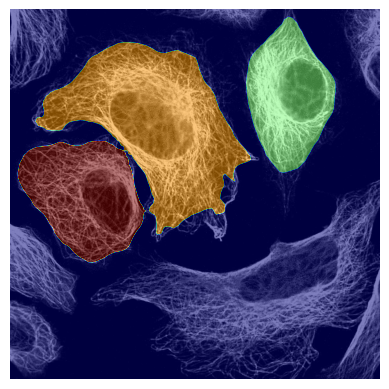
Segmentation results are written to the input_segmentation.h5 HDF5 file in a new data container called “segmentation”. In addition a csv file called classes.csv is generated which contains all the cell_ids that are not located in image edges and will be further processed.
If we look at the segmentation dataset we can see that it contains a numpy array containing two segmentation masks for each input image: the nuclear segmentation and the cytosol segmentation generated by our chosen segmentation method. If you use the method CytosolOnly both of the masks will be identical.
[14]:
plot_seg_overlay_timecourse(project_location, channel_to_show = 0)
plot_seg_overlay_timecourse(project_location, channel_to_show=1)

plot_seg_overlay_timecourse(project_location, channel_to_show = 0, seg_mask_to_show = 1)
plot_seg_overlay_timecourse(project_location, channel_to_show=1, seg_mask_to_show = 1)
<HDF5 dataset "segmentation": shape (10, 2, 2048, 2048), type "<u4">
<HDF5 dataset "input_images": shape (10, 3, 2048, 2048), type "<u2">
<HDF5 dataset "segmentation": shape (10, 2, 2048, 2048), type "<u4">
<HDF5 dataset "input_images": shape (10, 3, 2048, 2048), type "<u2">
<HDF5 dataset "segmentation": shape (10, 2, 2048, 2048), type "<u4">
<HDF5 dataset "input_images": shape (10, 3, 2048, 2048), type "<u2">
<HDF5 dataset "segmentation": shape (10, 2, 2048, 2048), type "<u4">
<HDF5 dataset "input_images": shape (10, 3, 2048, 2048), type "<u2">
Single-Cell Extraction
[15]:
project.extract()
WARNING:root:Folder /tmp/./temp_mmappc5_15oq with temp mmap arrays is being deleted.All existing temp mmapp arrays will be unusable!
WARNING:root:New temp folder location. Temp mmap arrays are written to /tmp/./temp_mmape8paw22r. Cleanup of this folder is OS dependant, and might need to be triggered manually!
(80, 5, 512, 512)
 10%|█         | 1/10 [00:04<00:37,  4.19s/it]/fs/gpfs41/lv07/fileset03/home/b_mann/maedler/Software/SPARCS_dev/SPARCSpy/src/sparcscore/pipeline/extraction.py:877: RuntimeWarning: invalid value encountered in cast
  px_centers = np.round(center_nuclei).astype(int)
100%|██████████| 10/10 [00:17<00:00,  1.71s/it]
The extracted single-cell images are written to a h5py file single_cells.h5 located under extraction\data within the project folder.
The file contains four datasets: single_cell_data, single_cell_index, single_cell_index_labelled, label_names.
single_cell_data contains the extracted single cell images while single_cell_index contains the cell id of the extracted cell at that location.
The other two datacontainers integrated the labels from the base dataset and attach them to each cell.
[19]:
with h5py.File(f"{project_location}/extraction/data/single_cells.h5")as hf:
    print(hf.keys())

    print(hf.get("label_names")[:])
    print(hf.get("single_cell_index_labelled")[2])
<KeysViewHDF5 ['label_names', 'single_cell_data', 'single_cell_index', 'single_cell_index_labelled']>
[b'index' b'cellid' b'image_URL' b'gene_id' b'antibody' b'species'
 b'cell_line' b'organ' b'cellosaurusID']
[b'2' b'4'
 b'http://images.proteinatlas.org/4109/23_H11_1_blue_red_green.jpg'
 b'ENSG00000000003' b'HPA004109' b'human' b'U2OS' b'Mesenchymal'
 b'CVCL_0042']
[20]:
# single cell index contains two columns, the first is the index position in the hdf5 datacontainer, the second is the cell id

with h5py.File(f"{project_location}/extraction/data/single_cells.h5")as hf:

    #print(hf["single_cell_index"][0:10])
    print(hf["single_cell_index"][2])
[[ 0  2]
 [ 1  3]
 [ 2  4]
 [ 3  8]
 [ 4 11]
 [ 5 12]
 [ 6 13]
 [ 7 14]
 [ 8 19]
 [ 9 20]]
[2 4]
[22]:
# single cell index labelled contains the same information as single_cell_index
# in the first two columns but adds additional columns with labelling information, the column names for
# the labelling information is contained in label_names

with h5py.File(f"{project_location}/extraction/data/single_cells.h5")as hf:

    print(hf["label_names"][:])
    print(hf["single_cell_index_labelled"][2])
[b'index' b'cellid' b'image_URL' b'gene_id' b'antibody' b'species'
 b'cell_line' b'organ' b'cellosaurusID']
[b'2' b'4'
 b'http://images.proteinatlas.org/4109/23_H11_1_blue_red_green.jpg'
 b'ENSG00000000003' b'HPA004109' b'human' b'U2OS' b'Mesenchymal'
 b'CVCL_0042']
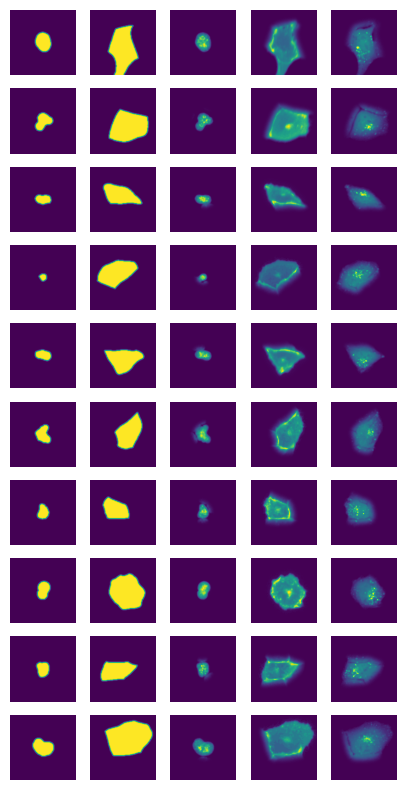
[39]:
visualize_single_cells(project_location)