Note
Go to the end to download the full example code.
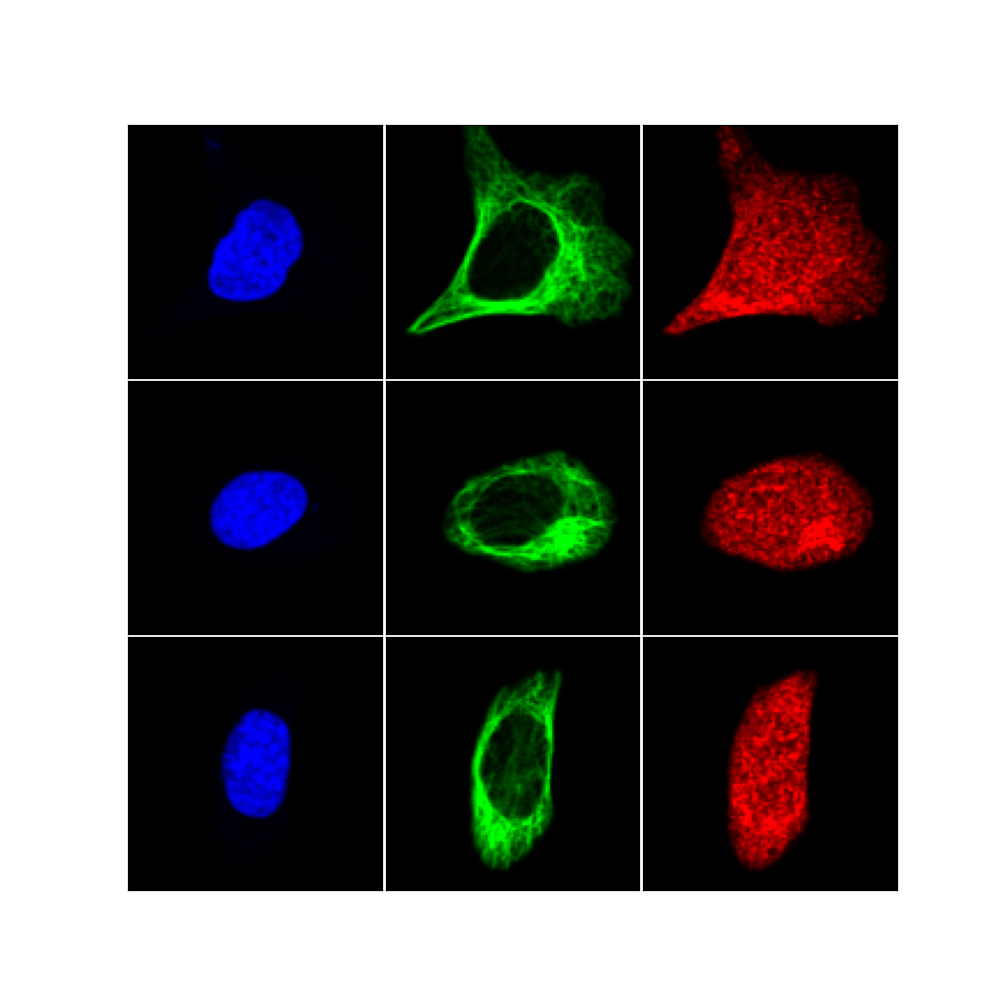
Plot single-cell image grid with colorized images#
import matplotlib.pyplot as plt
import numpy as np
from scportrait.pl import colorize
from scportrait.pl.h5sc import _plot_image_grid

from scportrait.data._single_cell_images import dataset2_h5sc

# get dataset
h5sc = dataset2_h5sc()

# select channels and cells you want to visualize
channels = [2, 3, 4]
cell_indexes = [0, 2, 5]
images = h5sc.obsm["single_cell_images"][:, channels][cell_indexes]

# specify colors for each channel as RGB tuples
colors = [(0, 0, 1), (0, 1, 0), (1, 0, 0)]

# generate colorized images
colorized = np.zeros((len(images), 3, 110, 110, 3), dtype="float64")
for i, img in enumerate(images):
    for ix, _ in enumerate(img):
        colorized[i][ix] = colorize(img[ix], color=colors[ix])

# resize array to have proper shape for plotting
input_images = colorized.reshape(3 * 3, 110, 110, 3)

# plot in a grid
fig, axs = plt.subplots(1, 1, figsize=(10, 10))
_plot_image_grid(
    axs,
    input_images,
    ncols=3,
    nrows=3,
)