

Note
Go to the end to download the full example code.
Generate RGB composite single-cell images#
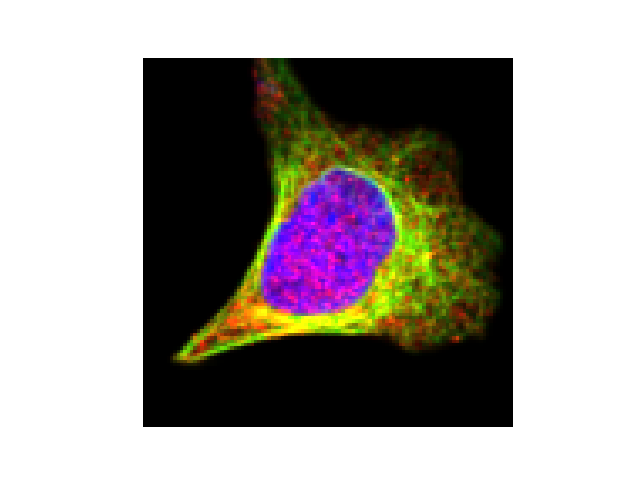
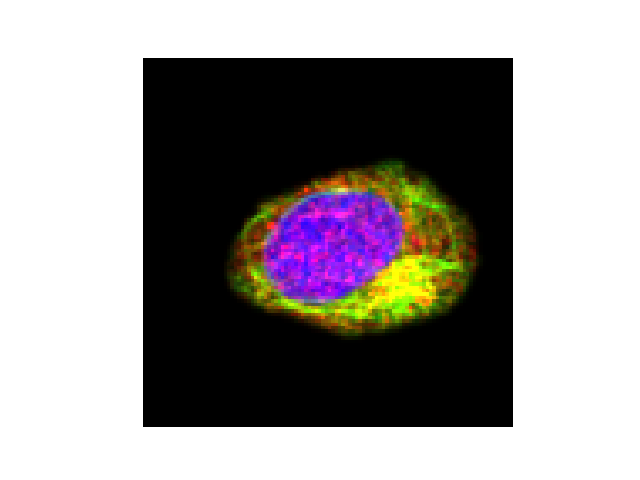
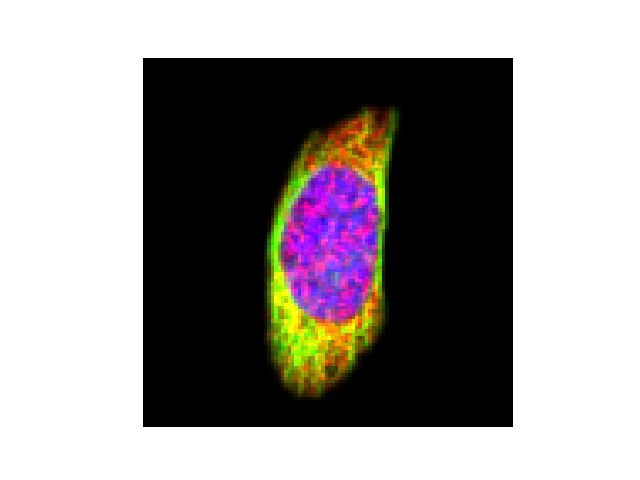
Downloading...:   0%|          | 0.00/213k [00:00<?, ?B/s]
Downloading...:   0%|          | 1.02k/213k [00:00<00:24, 8.76kB/s]
Downloading...:  39%|███▉      | 82.9k/213k [00:00<00:00, 317kB/s]
Downloading...:  86%|████████▌ | 182k/213k [00:00<00:00, 522kB/s]
Downloading...: 100%|██████████| 213k/213k [00:00<00:00, 430kB/s]
import matplotlib.pyplot as plt
from scportrait.pl import generate_composite

from scportrait.data._single_cell_images import dataset2_h5sc

# select images you want to plot and colorize
h5sc = dataset2_h5sc()
images = h5sc.obsm["single_cell_images"][:, 2:5][[0, 2, 5]]

for _i, img in enumerate(images):
    plt.figure()
    plt.imshow(generate_composite(img))
    plt.axis("off")